3 “Hidden” Reporting Group Features Posted by meaghan on Jun 23, 2021 in For Program Managers
Reporting Groups are all about visibility. ?
Immediately see who is meeting requirements and who isn’t. Whose ILR scores have fallen off. Who needs to retest soon.
With all that visibility, you might have overlooked a few key features that make it even easier to manage large groups of language learners.
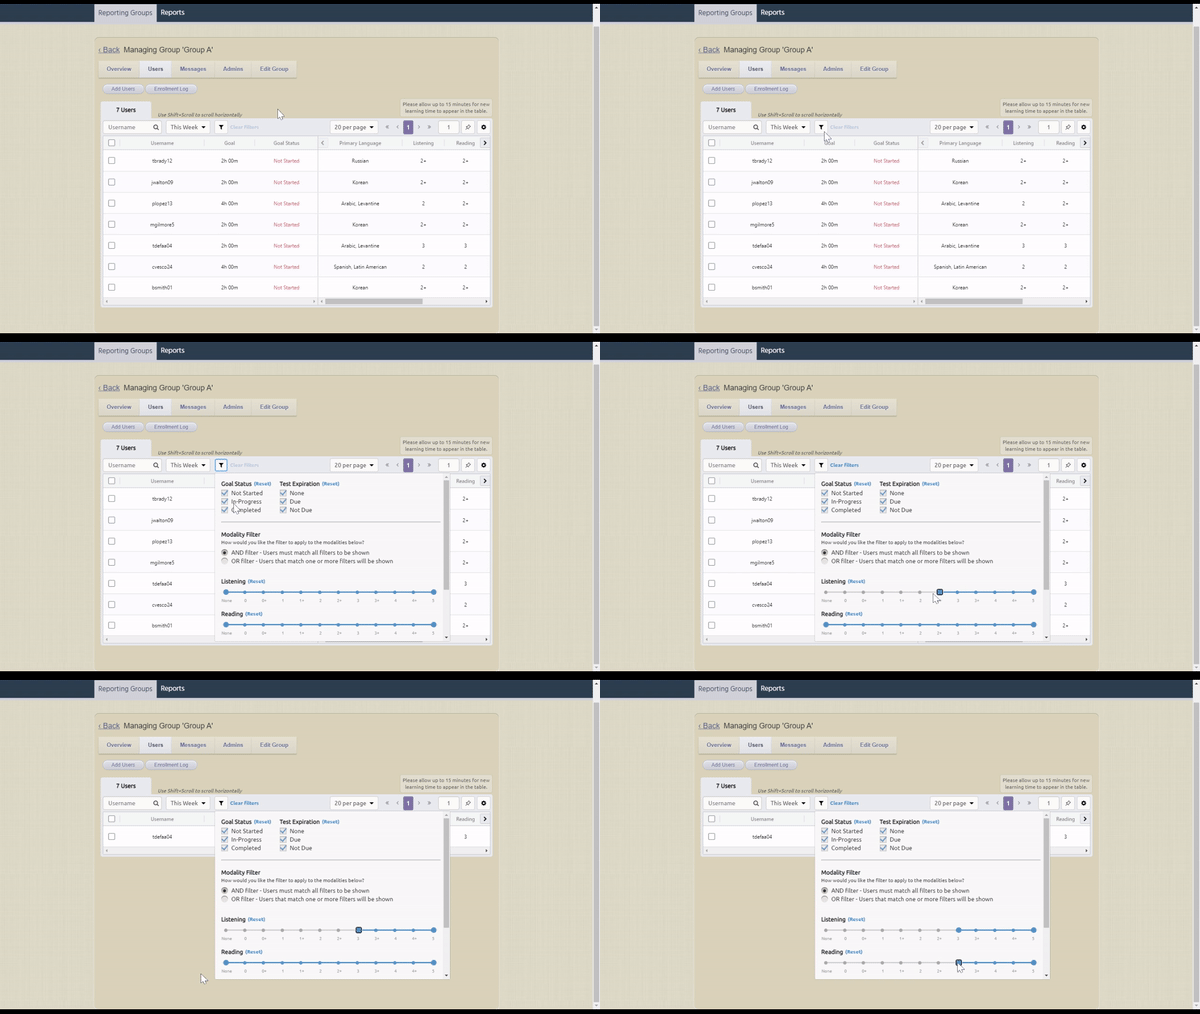
Filter your user table for easier bulk editing
The users table is your holy grail. It’s where you organize all of your learners’ data (ILR scores, test dates, etc.)
It’s also where you set weekly or monthly learning requirements, which can vary widely depending on your language policy. We’ve heard from many of you that hours increase or decrease in tandem with the learners’ ILR scores.
You can easily bulk edit any data point in the table using built-in filters.
Click on the funnel icon in the middle of the table header to filter by ILR score, bulk select all remaining users, and reset the requirement for all of them simultaneously.

Message your learners from the pie charts
Filled in your user table with all your data?
That data feeds the pie charts on the Overview dashboard, giving you an instant visual of how your linguists are doing.
But the pie charts aren’t just for viewing—they’re for taking action.
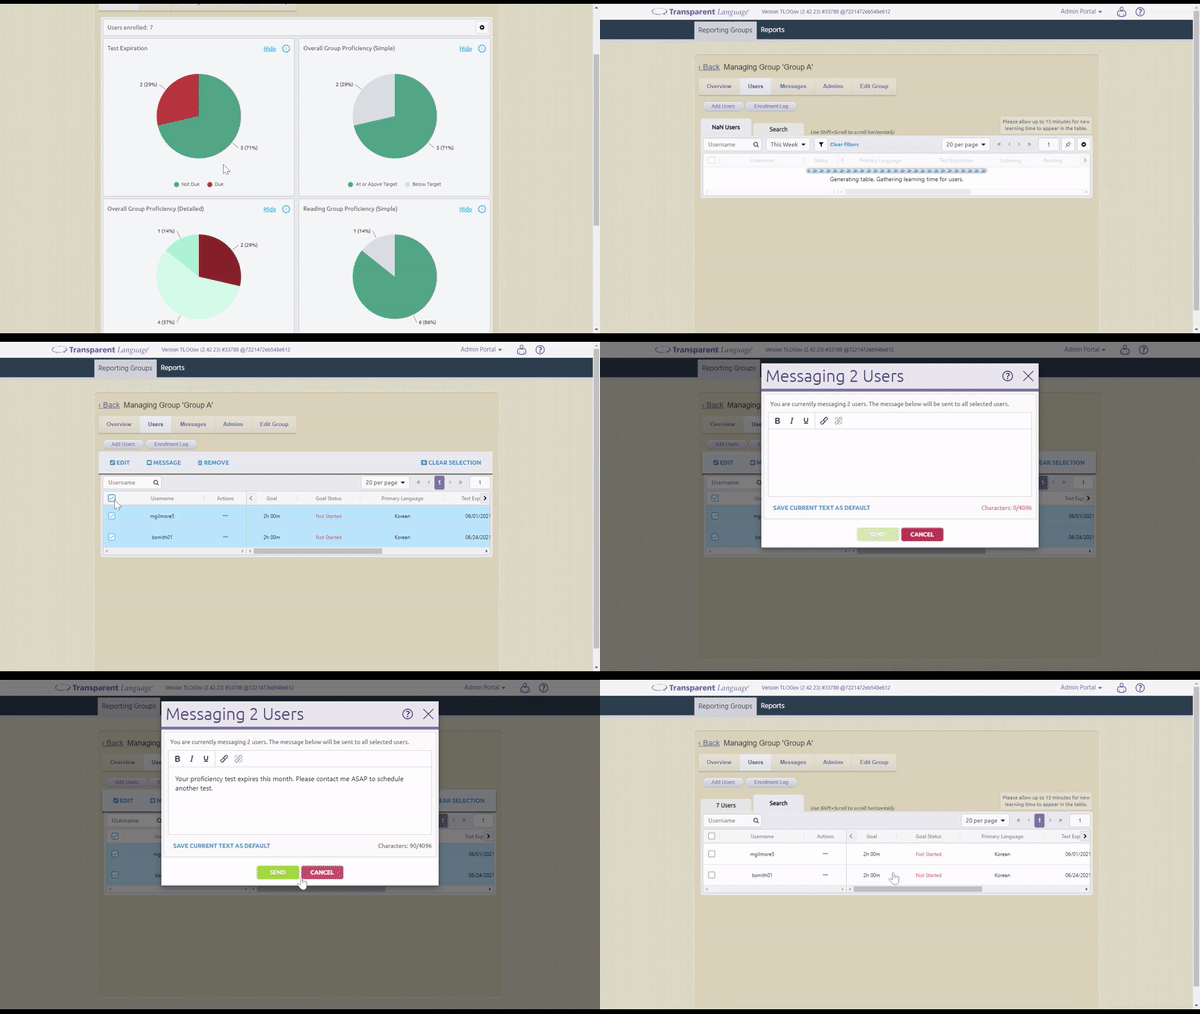
Click on any wedge of any pie chart to see a list of who is in that wedge, and immediately send them all a message:
- click on the “Due” wedge in the Test Expiration chart to send a reminder message about scheduling their next assessment
- click on the “Not Started” wedge in the Weekly Goal chart to send a message nudging those folks to get moving on their sustainment hours

Customize the pie charts dashboard
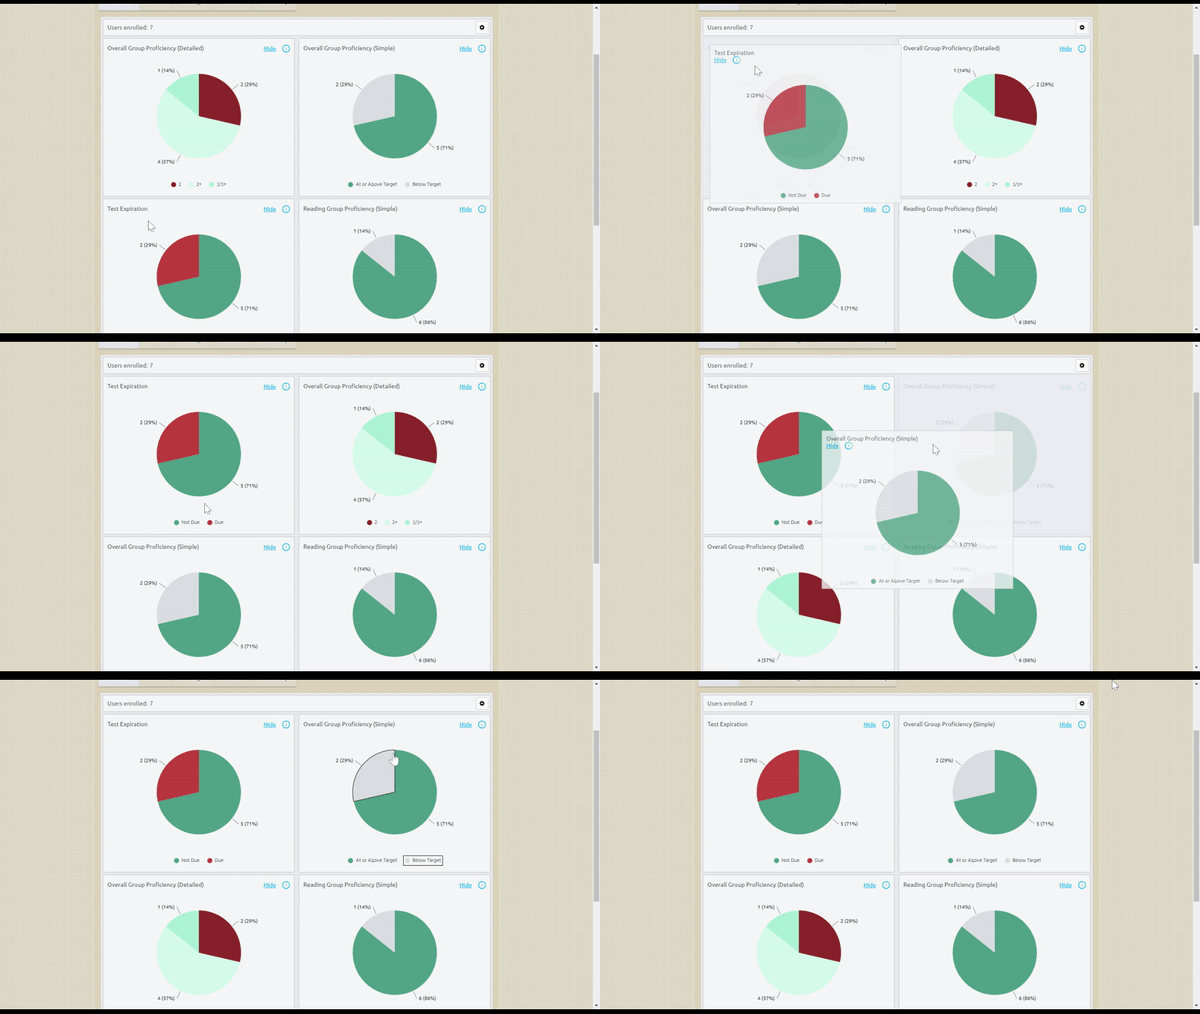
Speaking of the pie charts on the Overview dashboard, did you know you can re-order them?
Drag and drop so the charts that matter most to you are the first thing you see.
Or drag them into order and take screenshots, which you can share up or down the chain.
You can also click on the sprocket icon in the top right to turn charts on or off depending on your needs.

Reporting Groups make it quick and easy to keep all of your learners on track—or take quick action if they’re not. But it all relies on keeping the group up to date.
Need help setting up or maintaining the data in your Reporting Group? Watch the Program Manager training playlist in the help materials!


